Overview
Graph Builder is a feature that creates graphs from multiple Corvic Tables, enabling you to build knowledge graphs, property graphs, bipartite graphs, heterogeneous graphs, homogeneous graphs, and temporal (dynamic) graphs. Design custom graph schemas by connecting Corvic Tables through foreign key relationships, creating a graph view on your data.Category
Corvic Tables - This feature is designed to work with Corvic Tables, enabling you to create graph structures that serve as views on your tabular data.Input
Corvic Tables - The Graph Builder accepts multiple Corvic Tables as input. Click + Add to open the Select Inputs dialog and choose two or more Corvic Tables from your data room.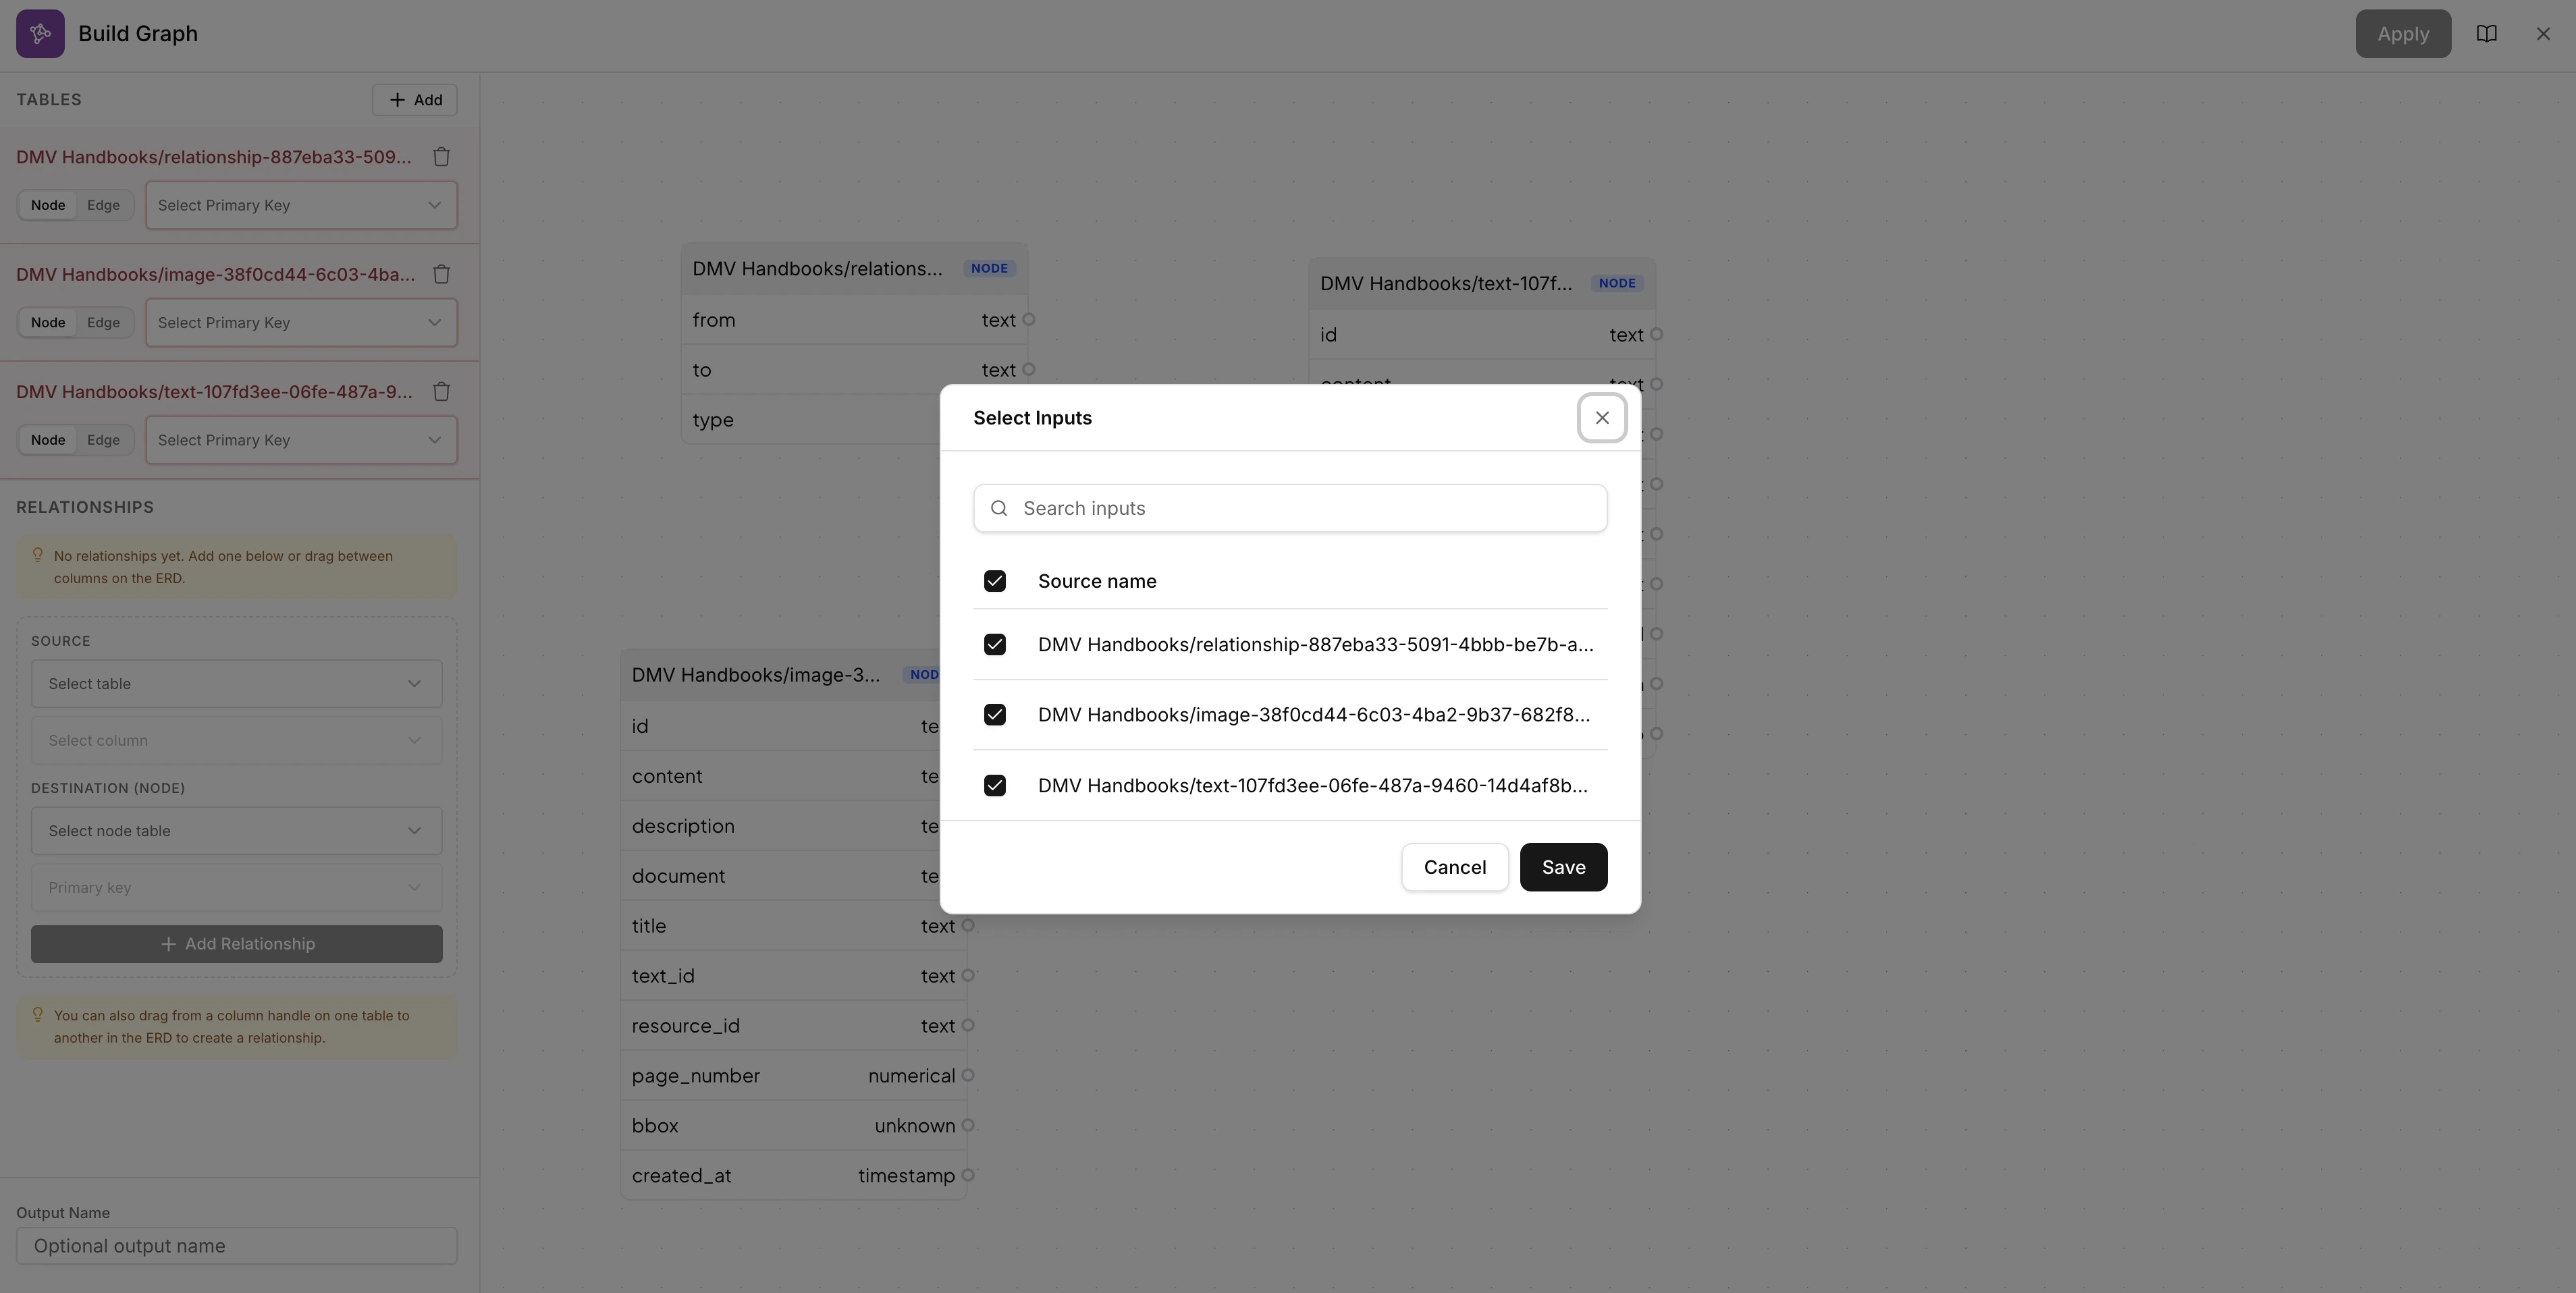
At least two Corvic Tables are required. The tables should contain columns that can form relationships (e.g., foreign keys referencing primary keys in other tables).
Configuring Nodes and Edges
Once your tables are selected, configure how each table participates in the graph. For each table, choose whether it represents a Node (entity) or an Edge (relationship), and select the primary key column. The center panel displays an ERD-style schema view of all selected tables with their columns and data types. The Graph Preview in the bottom right shows a live visualization of how your graph structure will look.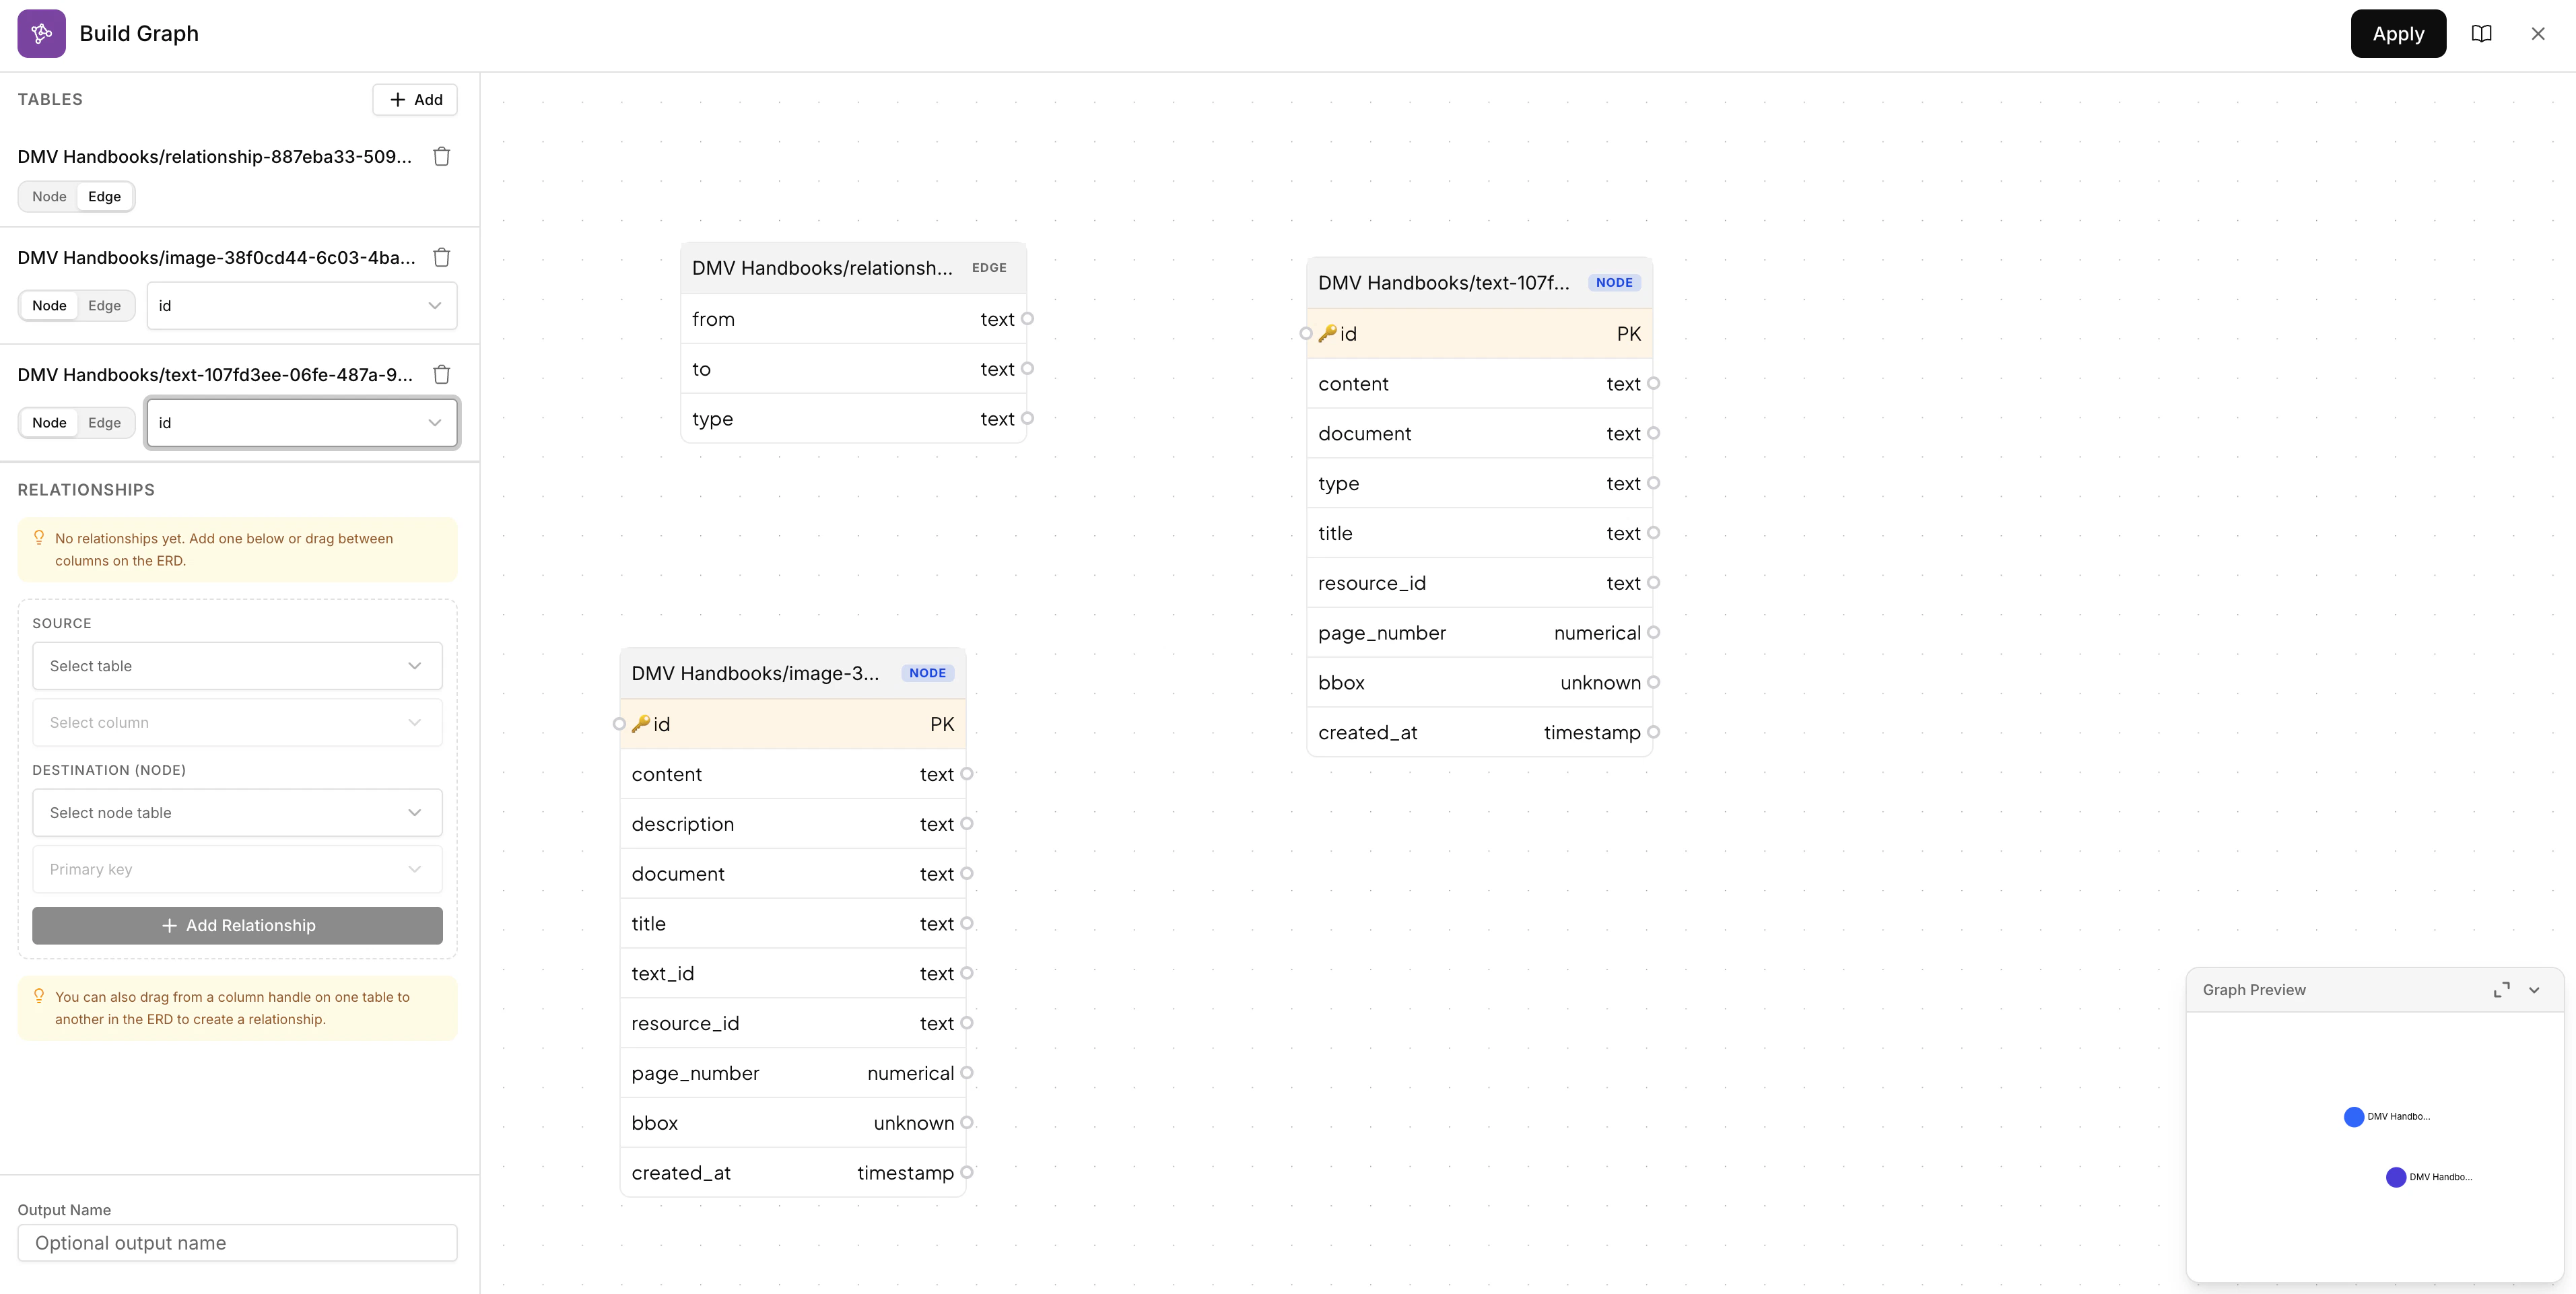
Creating Relationships
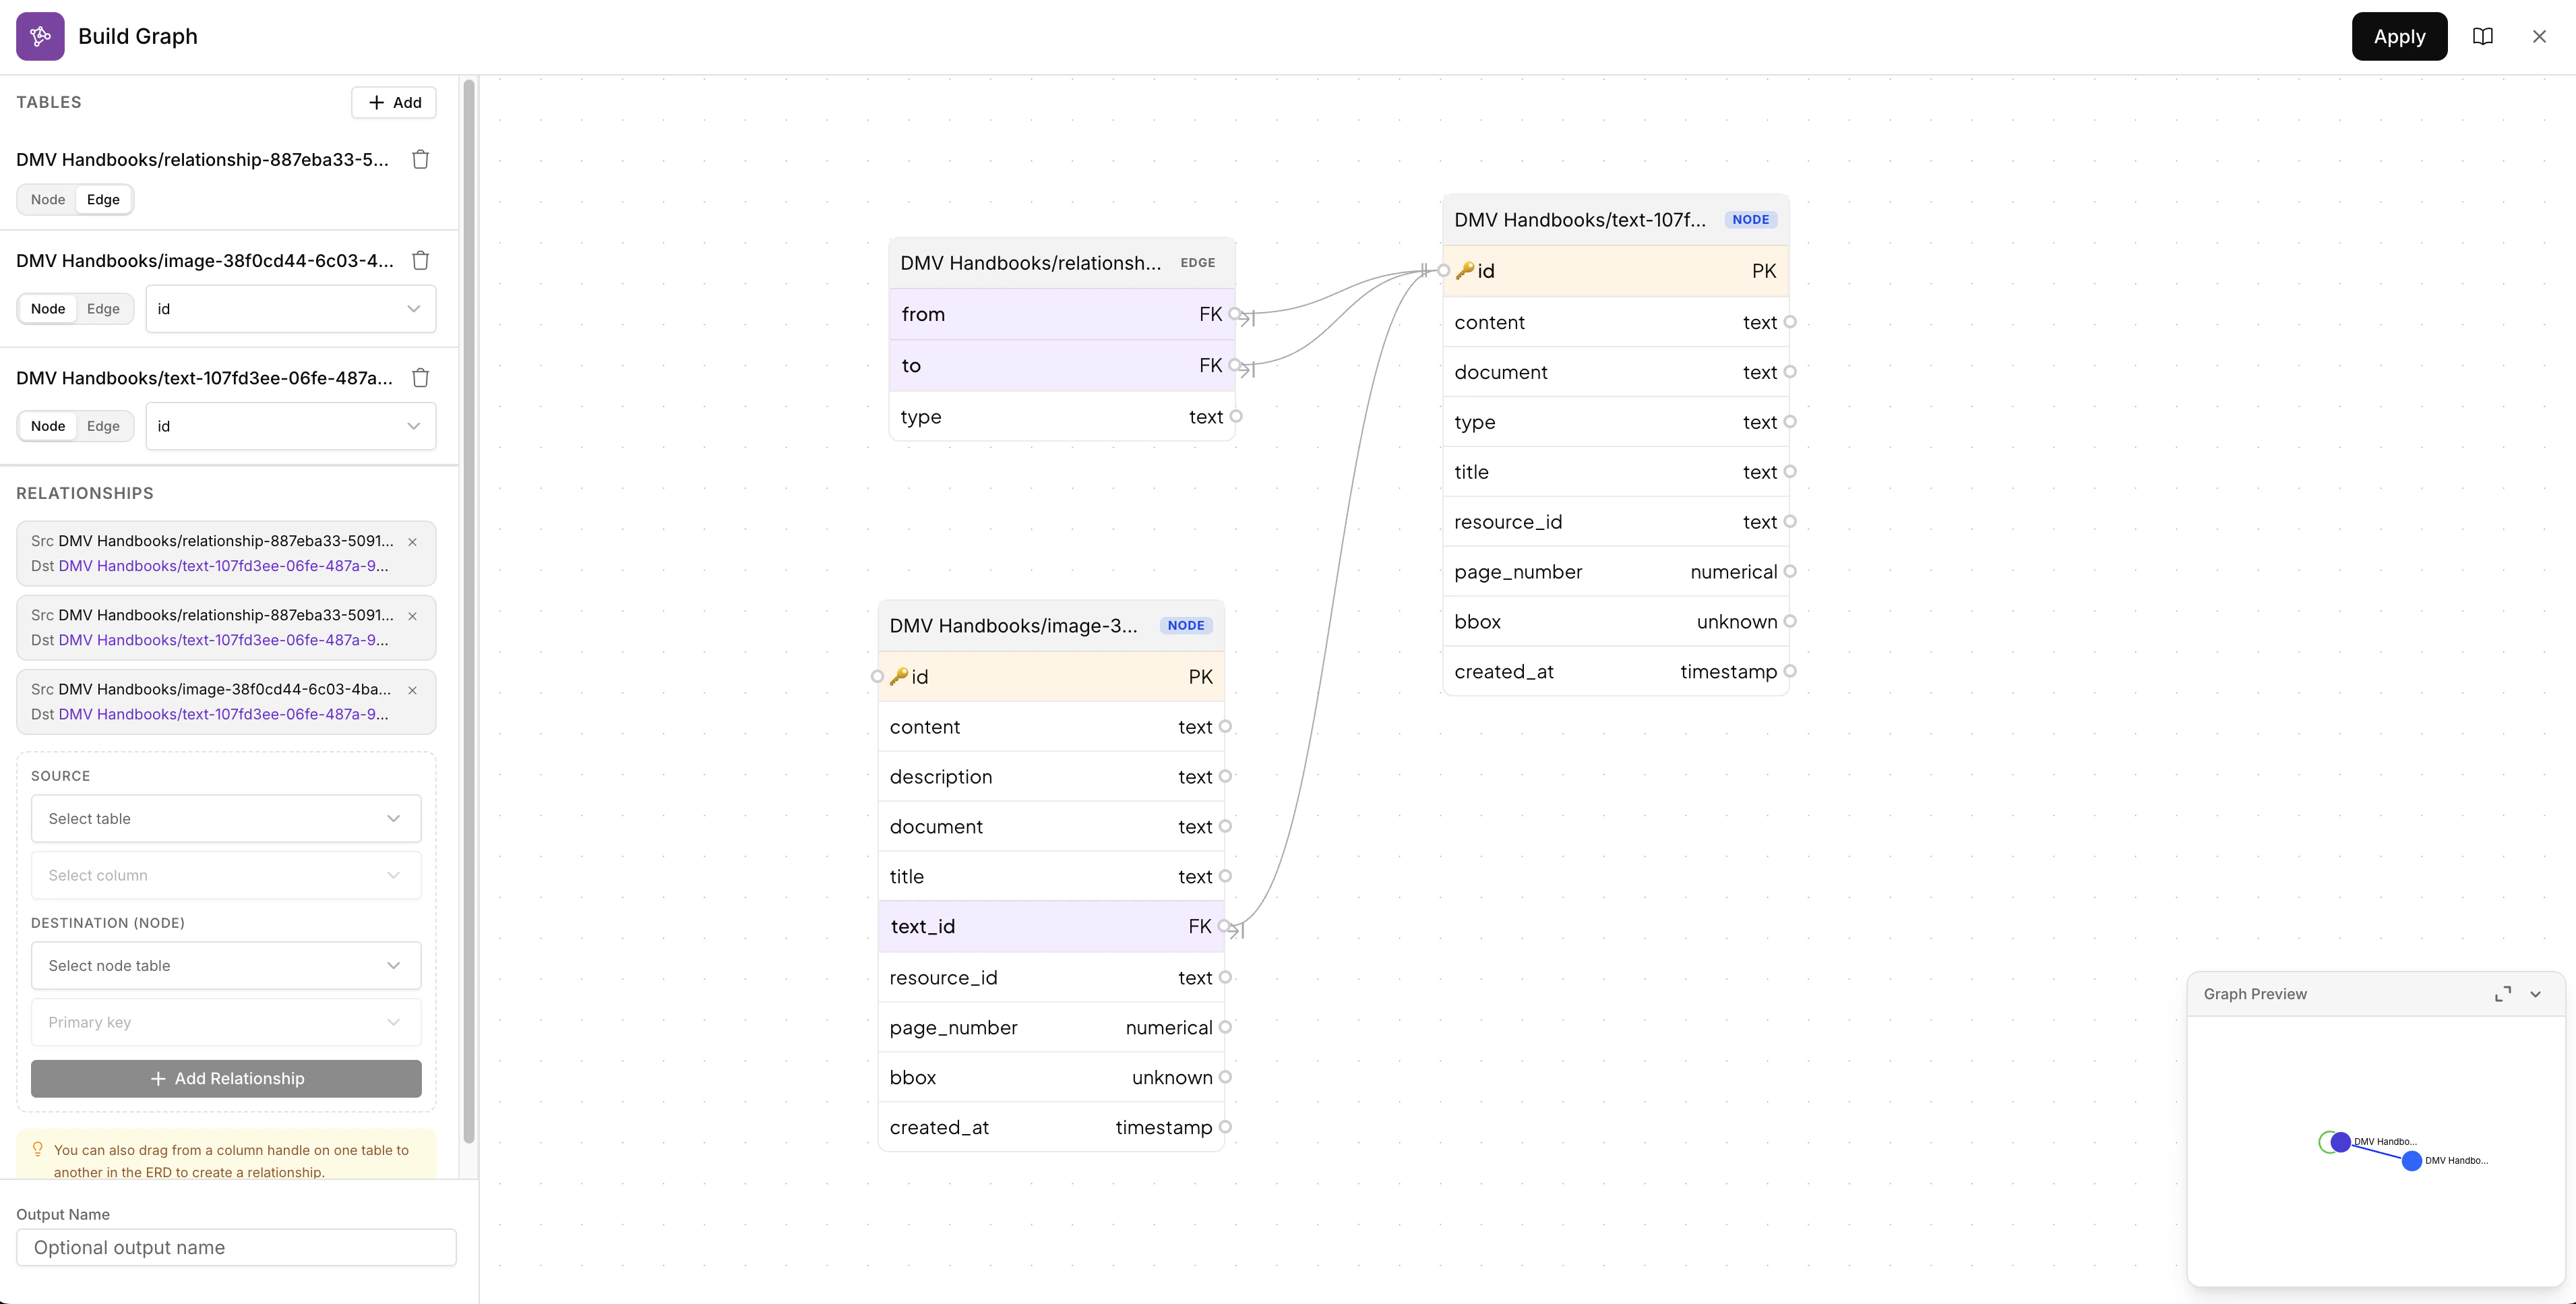
Define how your tables connect to each other. You can create relationships in two ways:- Drag and drop — Drag from a column handle on one table to a column on another table in the ERD view to visually create a foreign key relationship
- Manual setup — Use the Relationships panel on the left to select a Source table/column and a Destination node table/primary key, then click + Add Relationship
Output
Corvic Graph - The Graph Builder produces a Corvic Graph that serves as a view on your Corvic Tables. The output graph includes:- Graph Structure: Nodes and edges representing entities and relationships from your Corvic Tables
- Custom Schema: Graph schema defined by the foreign key relationships you configured
- Graph Types: Supports knowledge graphs, property graphs, bipartite graphs, heterogeneous graphs, homogeneous graphs, and temporal (dynamic) graphs
The output Corvic Graph enables graph-based analysis, relationship traversal, and relational embeddings via the Embed action. Provide an optional Output Name at the bottom of the Build Graph panel, or let Corvic auto-generate one.
Parameters
Usage Example
To use Graph Builder in a Workflow:- Add multiple Corvic Tables to the Workflow canvas
- Click the ”+” button next to one of the Corvic Tables
- Select “Graph Builder” from the actions menu
- Click + Add to select two or more input Corvic Tables
- Configure each table as a Node or Edge and select primary keys
- Create relationships by dragging between columns or using the Relationships panel
- Review the Graph Preview to verify the structure
- Optionally provide an output name
- Click Apply and run the Workflow
Related Documentation
Workflows
Learn how to build workflows using Workflows.
Corvic Tables
Understand how Corvic Tables work and how to create them.
Embed
Generate relational embeddings from Corvic Graphs.
Custom Knowledge Graph
Learn how to build custom knowledge graphs.